Does profile guided optimisation work and is it worth the hassle?
Recently, while exploring Python’s code base I stumbled upon these cryptic lines in its build system. I’ve never used profile guided optimisations before so, that led me into a goose chase to learn more about them. This post is about how to use clang to employ these optimisation techniques in practice and how much performance gains can be achieved (if any).
What’s profile guided optimisations (PGO)?
The main principles behind PGO can be described as:
- Build your code with instrumentation in place
- Collect runtime profiling data from instrumented code
- Rebuild your code once again with collected profiling data to apply optimisations
Why is this effective? During runtime, the instrumentation can collect data about which branches in the code are more likely to be taken and apply optimisations accordingly to favour them. That’s, of course, only one of the techniques. There’s a lot more. In general, the compiler collects runtime data that later can be used to drive optimisation heuristics in subsequent compile runs.
LLVM documentation provides a great reference with a lot more details.
Is this effective at all?
Well… it depends. The instrumented application will generate profiling data which can be later used by the compiler to optimise the application itself. So, the more specific your use case is, when generating the profiling data, the better your application will be optimised for that specific use case. But, with the increase of code coverage during profiling data generation, the less specific it becomes so, the optimisations that the compiler might introduce later on, will be less effective.
Experiments
Just to find out myself, I’ve decided to play around with bash and lua source code. There’s no specific reason for the choice. I had the repos cloned since I’ve worked with this code before already.
Bash experiments
There isn’t really a bash benchmark suite as far as I know so, I decided just
to test the waters with a couple of simple scripts. The first one just counts
up to a million.
|
|
The second one splits a large dataset (about 50MB of text data - I used GBvideos.txt from Trending Youtube videos dataset) by commas and concatenates all collected
fields into a one large string using “|” delimiter.
|
|
The point was to test two non-overlapping functionalities from bash and see how PGO will affect the performance.
Building bash with PGO
First, bash needs to be built with PGO instrumentation enabled:
|
|
Now, it’s time for data collection with each of the test scripts:
|
|
I’m using hyperfine as a benchmarking tool but I don’t really care about the results in this run - I just use it to conveniently run the scripts 10 times in a row and generate data from the instrumentation. Having the instrumentation data, it’s time to merge the raw data into a profiling dataset:
|
|
With the profiling data in hand, I’ll rebuild bash three more times and
actually use the data to apply optimisations:
|
|
I have now four executables to test with:
bash_vanilla- vanilla build with no PGO,bash_pgo_counter- build with PGO with data fromcounter.shruns,bash_pgo_csv_split- build with PGO with data fromcsv_split.shruns,bash_pgo_both- build with PGO with data from bothcounter.shandcsv_split.shruns.
Testing bash binaries with PGO
Let’s generate some benchmark results now:
|
|
Here’s the raw results for counter.sh:
|
|
Same set of benchmark results for csv_split.sh
|
|
Additionally, let’s graph these results.
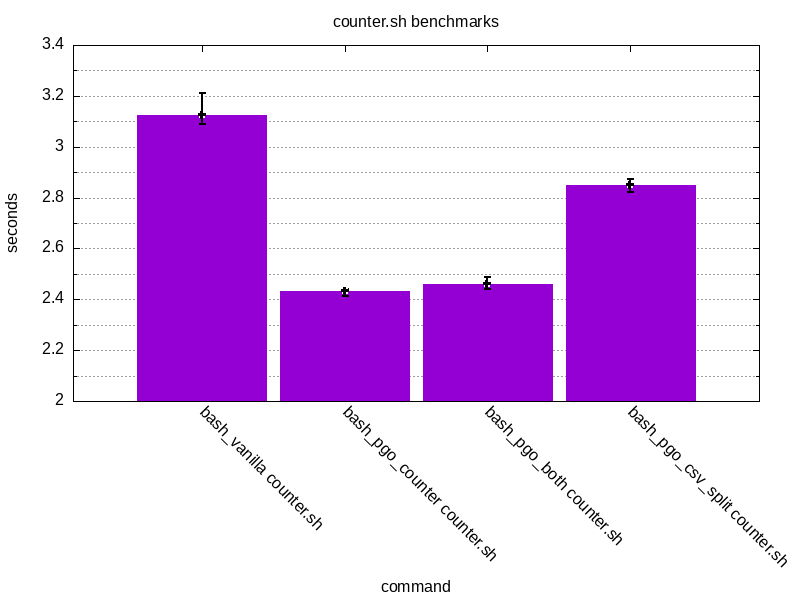
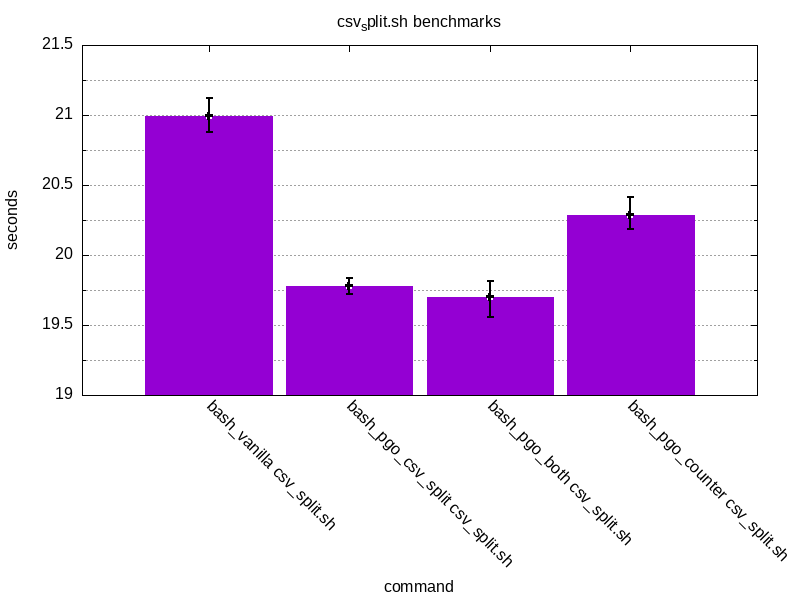
The results look promising. PGO has managed to shave off ~21% of counter.sh
and ~5% for csv_split.sh. An interesting thing is that there seems to be
less of an impact when trying to run something else than the thing which was
initially used for PGO. This is the case when running counter.sh with bash_pgo_csv_split or csv_split.sh with bash_pgo_counter.
The results are still better than with vanilla bash but not as good as with the original code used for instrumentation.
Experimenting with Lua
Since my bash test programs were extremely trivial, I decided to try something more representative with Lua interpreter. I’ve chosen Lua, as it’s nice and small and easy to build. Also, I’ve found a site with programming languages and compiler benchmarks and it seems to include Lua there as well so, it’s a perfect opportunity to try out the test code used there.
Just as before, I’m gonna prepare a vanilla version of the interpreter, one with instrumentation enabled and an optimised version. Judging by the results from the previous experiment, it seems that it’s not worth to focus on collecting profiling data for individual test programs so, I’m gonna apply PGO from profiling data collected from all test programs at once.
The entire test suite contains only 5 lua test programs. Out of these five, I’m gonna use the following four, invoked with the following parameters:
|
|
This is to assure a sufficient running time. After running the benchmarks, I’m left with the following results:
|
|
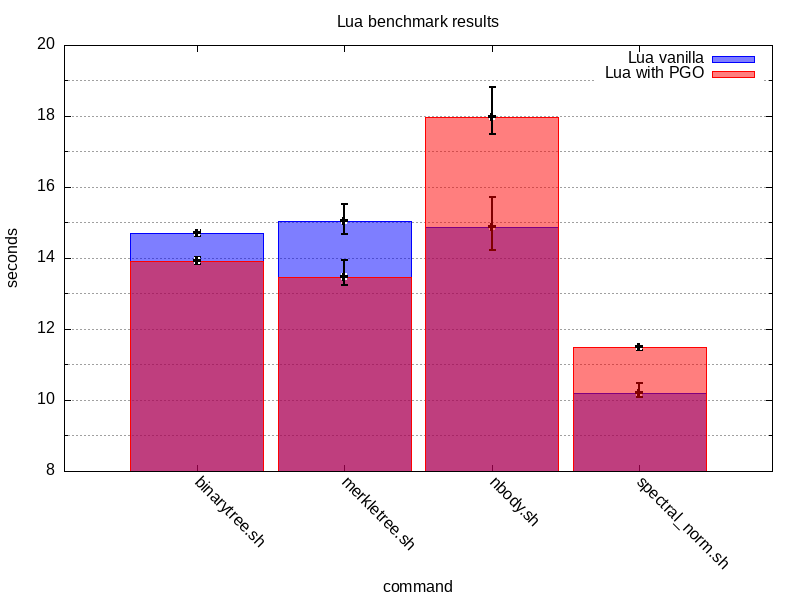
These results are a bit surprising. PGO worked for the first two test programs
but it made things worse for nbody and spectral_norm. This would indicate
that the overall set of optimisations applied is more biased towards some of
the test programs but not all of them.
As a last experiment, I wonder if applying PGO to profiling data collected only from programs that were initially negatively affected by optimisations would make any difference. Let’s find out.
After rebuilding and re-running the spectral_norm benchmark, the raw results
are actually still slightly worse than for an unoptimised Lua build:
|
|
My suspicion is that spectral_norm has substantial code coverage within Lua
interpreter itself and there’s simply no PGOs that can make any positive
impact. But, this is just a work in progress theory and I didn’t really
explore it well enough to understand the details better.
Conclusion
PGO can be a mixed bag. It’s definitely not a one size fits all solution that will unequivocally improve the performance every time when applied. It might help to make things slightly better for a very particular use case but at the same time sacrifices might be made outside of that use-case. In order to achieve stable, reproducible results a lot of trial and error might be required.
Just for my own reference, here are the links to gnuplot scripts