Profiling and code instrumentation
I’ve recently watched a video from TheCherno about visual benchmarking.
In short, he’s using a simple timer class in C++ to collect execution timings of his code and then generate a json file containing profiling data which can be visualised using chrome tracing.
He’s using a set of macros to automatically get function names when instrumenting the code.
This gave me an idea to actually use gcc instrumentation to inject the timers globally into the entire program and collect the data without having to manually instrument the code. Additionally, I’m gonna experiment with LLVM Xray instrumentation which makes the whole process even more simpler.
Timers
Just like “Cherno” did, let’s start with an implementation of a simple timer.
|
|
Additionally, I’m gonna write a simple class that uses this timer, RAII style. It takes a name (for the purpose of instantiating the timer) and two callbacks. First callback is called in constructor and the second one in destructor. It basically allows for probing the timestamps upon scope entry and exit. Here’s the implementation:
|
|
This can be used the following way (the callbacks are just to demonstrate the principle - they’re not exactly useful in their current shape and form):
|
|
This a bit too involving and can be easily simplified to be:
|
|
This simple code can measure the execution of any scope. Introducing this to any code base shouldn’t pose a challenge at all as there are literally no dependencies. Let’s take this a step further though.
Trace file format
The file format that about:tracing accepts is described in details here.
Now, I’m gonna need a couple of more functions to generate event data that chrome tracing tools can accept:
|
|
Now, with emitEvent, ScopedProbe callbacks can actually do something useful.
|
|
This will produce “B” and “E” events which indicate beginning and an end of an event. For the purpose of profiling, an event indicates the duration of function’s scope. I’m using json::nlohmann to generate the JSON array containing the event data. To test this, I’m gonna use this very simple program:
|
|
The program should output a JSON array of event objects looking like so:
|
|
When visualised using about:tracing this should resemble the
following execution timeline:
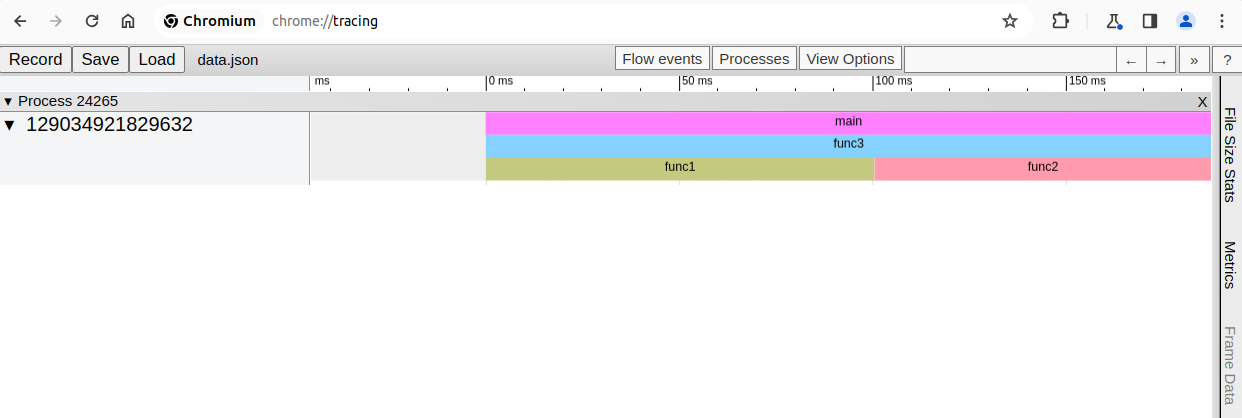
The code for this example can be found here.
Gcc function instrumentation
This is all cool when you want to focus on a specific subsystem. The problem
is that it would require a lot of work to inject these profiling probes all
over the place in a large code base. My first thought was to try gcc’s
function instrumentation (after all this is how LTTng works). Gcc can
insert special function calls to __cyg_profile_func_enter and
__cyg_profile_func_exit during build time for every function in the program.
All you have to do is to compile your code with -finstrument-functions. That
way, execution timings can be collected without much effort. More information
is available in gcc’s
manuals.
Your program needs to define two functions:
|
|
There are two important things to bear in mind though:
- Symbol names
- Infinite recursion
Symbol names
All we get in these callbacks is an address of a function which is about to
be called. No symbols at all. This can be solved with libdl and dladdr. To do that, I’ve written a small helper function:
|
|
There’s a small gotcha with dladdr. It works for shared libraries containing
a dynamic symbol table. To make it somewhat work with standalone executables,
inclusion of executable’s symbols can be forced with a linker flag:
-E
–export-dynamic
–no-export-dynamic
When creating a dynamically linked executable, using the -E option or the –export-dynamic option causes the linker to add all symbols to the dynamic symbol table. The dynamic symbol table is the set of symbols which are visible from dynamic objects at run time.
Having that, I’m ready to define the callbacks:
|
|
Infinite recursion
The problem with -finstrument-functions is that it’s somewhat tedious to get
it to work. What I mean by that? Well, as I said, the compiler will
instrument all functions. That means __cyg_profile_func_enter and
__cyg_profile_func_exit as well (unless you put these in a separate library
which is built with instrumentation turned off). Which, of course, will lead
to infinite recursion. Additionally, any function called within these
callbacks will trigger a callback as well - another infinite recursion entry
point. Fortunately, gcc provides some attributes and compiler flags to form an
ignore list and break these cycles. Specifically:
__attribute__((no_instrument_function))- which can be added to function declarations for functions that should not be instrumented,-finstrument-functions-exclude-file-list=file,file,...- takes a comma separated list of file path patterns to ignore (all functions defined in files that match the pattern will not be instrumented),-finstrument-functions-exclude-function-list=sym,sym,...- takes a comma separated list of function names to ignore (important detail: the symbol names listed here shouldn’t be mangled).
In my test project, I’ve put the instrumentation callbacks in a separate shared
library (libcyg.so). The test executable will just link this library in. To make things
simple, I’ve added the following compiler flags to ignore the symbols of
functions used within instrumentation callbacks:
|
|
Within the library, I’ve marked all functions that are used within __cyg*
callbacks with __attribute__((no_instrument_function)).
After building the project, I’m left with the same results as with manual instrumentation, but I didn’t have to manually insert any profiling probes. I’m on the right path.
The code for this example can be found here.
Instrumenting bash
I was wondering what kind of problems and obstacles I’d have to deal with when
applying this approach to a production software. It’s also a good test if this
technique is any useful for a real life purpose. Completely arbitrarily I’ve
chosen bash as my test subject to find out. I’m gonna use libcyg from my
previous test project. To avoid compiling an extensive list of functions which
shouldn’t be instrumented, I’m gonna build libcyg with instrumentation turned
off. To inject the instrumentation, I’ll have to link with this library and add
required compiler flags to bash’s build system.
In my test scenario, I’m gonna collect profiling data from a bash -c invocation.
To do that, I’ll have to add dumpEvents function call (from libcyg) to shell.c. Here’s the patch:
|
|
I’ve copied both cyg.hpp and prebuilt libcyg.so from my previous
experiment. bash doesn’t use automake (in a sense that there’s no
Makefile.am). It comes with Makefile.in which is a template populated by
configure. Initially I thought I’d have to inject the instrumentation flags
there but these can just be given in a call to configure:
|
|
As you can see, the exclude patterns list as well as the symbols lists are both quite elaborate. This is the biggest draw back of this technique. Determining and defining a set of functions which shouldn’t be instrumented requires some trail and error. I imagine that in a really complex projects where deployment is a multi-step process it might even be a deal breaker. Once I’ve managed to break all recursive loops, I was successfully able to collect some profiling data.
Here’s a birds eye view of ./bash -c "echo hello":

It’s possible to zoom into specific execution fragments.
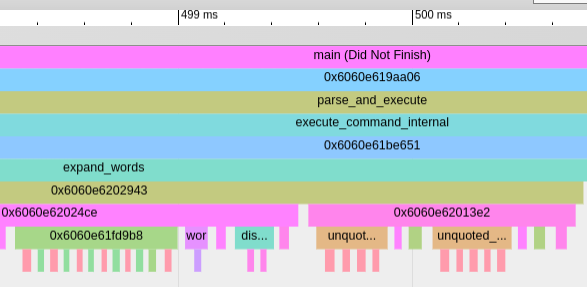
Zoomed in even more:
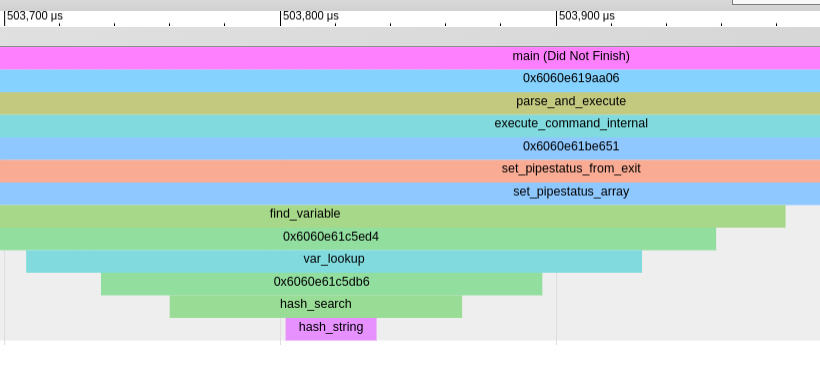
In general, this technique is very useful to get a complete overview of what’s happening within the code. But… there’s something even more convenient.
clang XRay instrumentation
There’s actually a much easier and quicker way to instrument the code and collect profiling data. clang xray instrumentation is a batteries included all in one solution which can both instrument the code automatically and provides necessary tooling to work with collected data. LLVM provides a great example on how to get started with XRay and I recommend this document as a starting point very much so.
clang XRay bash
This is gonna be surprisingly easy.
|
|
After rebuilding, I’m gonna check for XRay instrumentation section presence (just as the example suggests):
|
|
There are no further prerequisites. I just need to run the program:
|
|
LLVM comes with some useful tools. It’s possible to get the classic gprof like output:
|
|
… or to generate a detailed call graph in dot format:
|
|
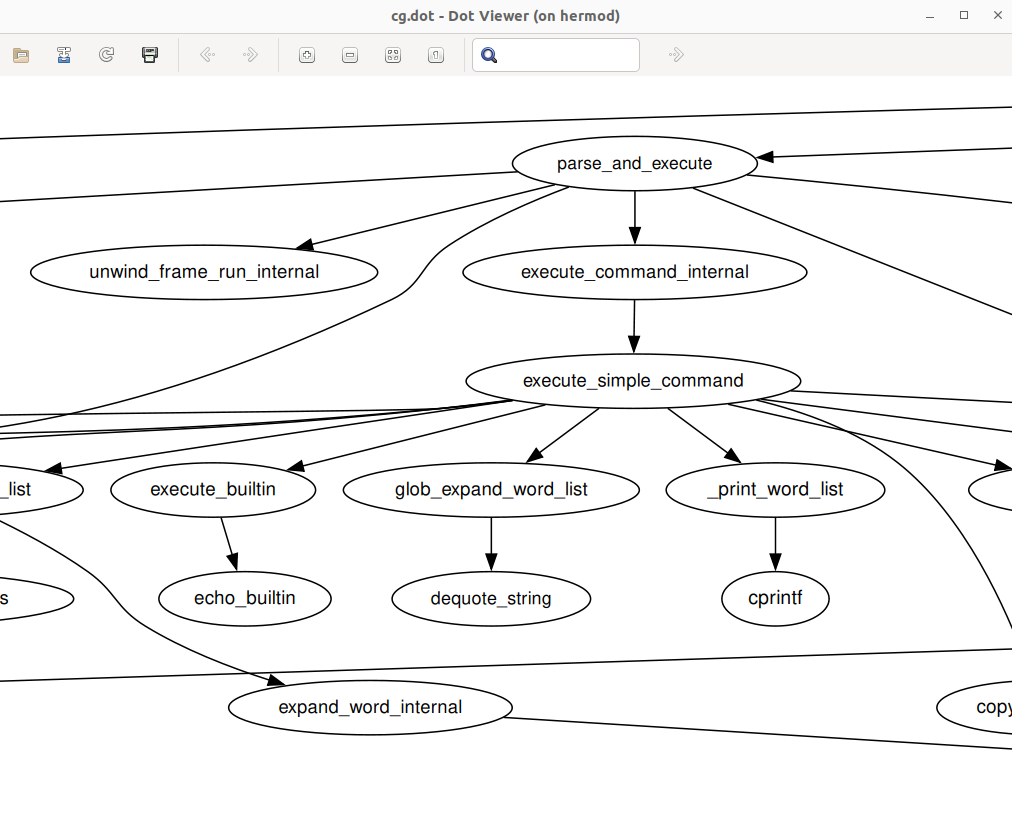
Or even directly generate trace event compatible execution profile that can be viewed in chrome tracing tool:
|
|
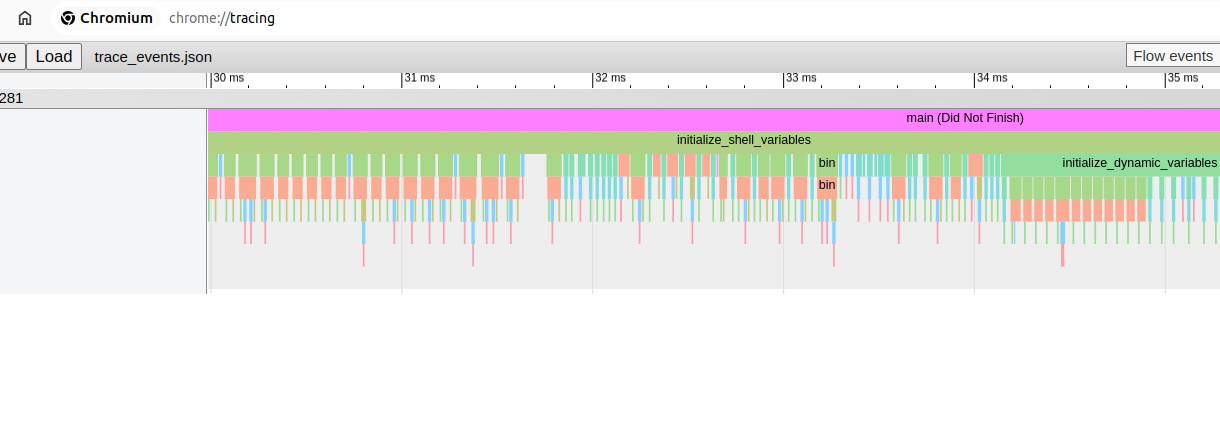
The output is even better than with gcc’s instrumentation as clang has resolved all symbols for us!
Conclusion
chrome tracing tool is a great data visualiser and I’m happy that completely accidentally I’ve learned about it. This is something I’d definitely recommend to try out when attempting not only to measure program execution details but as a quick way to understand the program flow in general. I’ve barely scratched the surface with both chrome’s tracing tool and clang’s xray instrumentation but hopefully I’ve managed to provide good example of how useful these tools might be.
Additionally, it seems that chrome tracing tool accepts timing data in ftrace
format. This is a kernel specific tool but accordingly to some discussions
referring to Android it’s possible to use it in user space as well.